


Prior to the crash of 2008 global trade was rocking. It was a boon for shipping companies around the world who are responsible for moving raw materials, commodities and consumer products from one country to another. Wall Street, of course, had devised a way to track all of this movement and often pointed to the Baltic Dry Index (BDI) as the primary indicator for health in the global trade business.
The index itself tracks the cost of transporting one metric ton of raw materials from one place to another.The numbers behind the BDI can essentially be translated into the cost of moving that cargo.
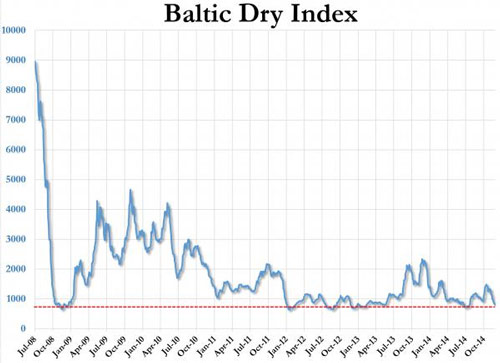
During the collapse in late 2008 we saw the Baltic Dry Index drop from over 9,000 points to under 1,000 in a matter of months. So, in essence, when the world economy was supposedly booming the cost for moving raw materials was around $9,000 per metric ton. After credit markets locked up and companies stopped ordering inventory the price dropped below $1,000 for moving the exact same raw materials to the exact same place.
What happened to the cost of transporting raw materials and cargo is exactly what you might expect with respect to the economics of it all. When businesses around the world are ordering inventory you’d expect shippers to raise the price of transporting that cargo as demand for their services increases. Likewise, if businesses don’t sell their products they will order less in raw materials, forcing shipping companies to lower their costs as demand for their services drops.
It is for this reason that the Baltic Dry Index has become such a key indicator of economic health and stability.
It would stand to reason, then, that if the value of the BDI is falling then a slow-down in global trade is taking place.
Prepare to be shocked, because despite the glowing reports from the U.S. government about the economic recovery, the Baltic Dry Index has collapsed to nearly the same levels we saw in 2008.
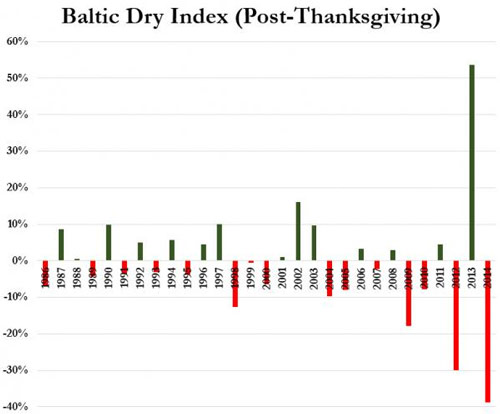
According to Zero Hedge, what we have witnessed since Thanksgiving is the biggest collapse in the ‘trade’ indicator since records began 28 years ago.
The following charts tell you everything you need to know about the purported economic recovery and it isn’t pretty.
We are sure it’s nothing – since stock markets in China and The US are soaring – but deep, deep down in the heart of the real economies, there is a problem. The Baltic Dry Index has fallen for 21 straight days, tumbling around 40% since Thanksgiving Day.
Here is a chart of the Baltic Dry Index showing where it was before the Crash of ’08 through last month. What you’ll notice is that we are right at the lows witnessed during the height of the crisis in late 2008.
To say that there has been a massive slow-down in global trade does not do justice to the seriousness of what’s happening.
Central banks around the world have literally pumped trillions of dollars into the system over the last several years and the only thing they have really accomplished is to send stock markets to new highs and the enrichment of bankers who have had the benefit of money with no borrowing costs.
Other than that we are seeing a total destruction of the economy. Consumers aren’t buying. Decent jobs are nowhere to be found. And costs for average people are going up in the form of taxes and essential goods.
We can pretend like none of this matters, but the Baltic Dry Index is throwing up a clear warning sign of what’s to come.
If you have yet to prepare for the possibility of an economic disaster in the near future, now is the time.
Source:: ShtfPlan